This website is best viewed on modern browsers (including Internet Explorer 8.0 or higher, Chrome and Safari). Please update your browser for the best experience. X
UNICEF STATISTICS
  UNICEF Data: Monitoring the Situation of Children and Women
About this area This part of the website presents the most up-to-date data and analysis on the situation of children.

Latest publication

Statistics by Country
Current Status + Progress
The Millennium Development Goal (MDG 7) drinking water target has been met, but marked disparities persist

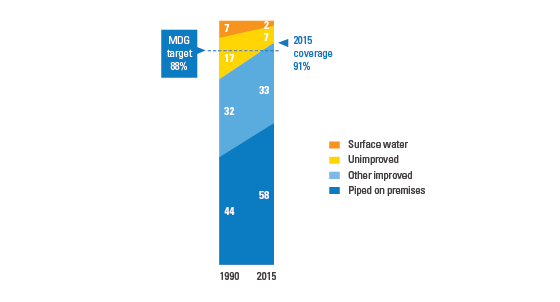
Universal access to safe drinking water is a fundamental need and human right. Securing access for all would go a long way in reducing illness and death, especially among children. In 2015, 91 per cent of the world’s population use improved drinking water sources, exceeding the 2015 Millennium Development Goal target of 88 per cent. Over the MDG period 2.6 billion people gained access to an improved drinking water source, of these 1.9 billion gained access to a piped supply on premises. Despite this enormous accomplishment, troubling disparities persist: 663 million people do not use an improved drinking water source, most of whom are poor and live in rural areas. Questions also remain about the safety of ‘improved’ drinking water sources that may not always be free of contaminants and may not provide a reliable supply of water throughout the year.

REGIONAL PROGRESS

Five developing regions achieved the MDG target for drinking water
Use of improved drinking water sources and MDG target in 2015, and percentage point change from 1990 to 2015

Source: WHO/UNICEF JMP Progress on Sanitation and Drinking Water: 2015 Update and MDG assessment

Since 1990 there have been substantial increases in coverage of improved drinking water sources across many regions, with five developing regions meeting the MDG target of halving the proportion of the population without access. Notably, in Eastern Asia use of improved drinking water increased by 27 percentage points between 1990 and 2015, with over half a billion gaining access in China alone. Coverage of improved drinking water sources now exceeds 90 per cent in many developing regions. In contrast, less than three-quarters of the population uses an improved source in both Oceania and sub-Saharan Africa. Although much remains to be done, impressive increases have been achieved in sub-Saharan Africa where an average of 47,000 people gained access every day since 1990, an increase of 20 percentage points.

COVERAGE BY COUNTRY

Countries in which less than 50% of the population uses improved drinking water sources are all located in sub-Saharan Africa and Oceania
Proportion of the population using improved drinking water sources in 2015

Source: WHO/UNICEF JMP Progress on Sanitation and Drinking Water: 2015 Update and MDG assessment

Despite the achievements of the MDG period, a great deal remains to be done. Behind the global headline figures, huge disparities in access remain. While many developed regions have now achieved universal access, coverage with improved drinking water sources varies widely in developing regions. The lowest levels of coverage are found in the 48 countries designated as the least developed countries by the United Nations, particularly those in sub-Saharan Africa. There are now only three countries where less than 50% of the population uses an improved source (Angola, Equatorial Guinea and Papa New Guinea) compared with 23 countries in 1990.  

RURAL-URBAN DISPARITIES

In most regions, use of piped water on premises has increased faster in rural areas, but urban coverage remains higher
Rural-urban gap in coverage of piped water on premises by region (%), 1990–2015

Source: WHO/UNICEF JMP Progress on Sanitation and Drinking Water: 2015 Update and MDG assessment

While progress has been impressive, disparities exist between different social and economic groups and coverage depends strongly on where you live. The disparity between urban and rural areas is pronounced in many countries: in 2015, eight out of ten people without improved drinking water lived in rural areas. In nearly all regions, however, the gap in access to piped water at home has been narrowing. 

DISPARITIES BETWEEN RICH AND POOR

Use of improved drinking water sources varies by wealth quintile in urban and rural areas
Use of improved drinking water sources by urban and rural wealth quintile, (%) in 2012

Source: WHO/UNICEF JMP Progress on Sanitation and Drinking Water: 2015 Update and MDG assessment

There is a strong relationship between wealth, as measured by household assets, and use of improved drinking water sources. In many countries increases in coverage have not been equitably distributed with the wealthy gaining most of the benefits. Figure 5 shows improved drinking water coverage for each wealth quintile in both rural and urban areas. Each country is represented by a vertical set of
five dots arranged according to average coverage for that country. The vertical spread of the dots shows the extent to which coverage varies between the richest and the poorest quintiles in each country. The differing patterns of dots also highlight variations in the relative gaps between the richest, fourth, middle, second and poorest quintiles. These data demonstrate the extent to which the poorest continue to be disadvantaged – especially in rural areas – and that in many countries they have not benefitted from gains in drinking water coverage. 

WATER SAFETY

Improved sources are frequently contaminated with faecal indicator bacteria
Faecal contamination of drinking water, by source type and Millennium Development Goals region

Source: WHO/UNICEF JMP Progress on Sanitation and Drinking Water (2014)

The “improved source” indicator is based on classification of water supplies by facility type and does not account for direct measurements of water quality. Although it is known that improved sources are less likely to be contaminated than unimproved sources, they are not always free of contaminants. Estimates suggest that almost 2 billion people use an unimproved source or an improved source that is contaminated with faecal indicator bacteria suggesting a need for greater attention to water safety and its management in many countries.

Proposals for post-2015 monitoring call for better tracking of improvements in service quality – including water safety, accessibility and availability. 


Access The Data
Water and sanitation coverage
Drinking water Download Data
Recent Resources
Sort by: Date | Type
Publication

Drinking Water: Equity, safety and sustainability - 2011 Thematic Report

This thematic report on drinking water highlights the substantive challenges that remain in achieving safe, sustainable and equitable access to drinking water.


Publication

Progress on Drinking Water and Sanitation - 2014 Report

The world has made great strides in increasing access to drinking water and sanitation for billions of people but progress has been uneven. 

This joint WHO/UNICEF report documents the gains that have been made since 1990 and highlights substantive disparities such as those between regions, rural and urban areas and for marginalized groups. 


Web Application

JMP Website

WHO and UNICEF have monitored access to drinking water and sanitation through the Joint Monitoring Programme (JMP) for Water supply and Sanitation since the early 90s.


Publication

Progress on Sanitation and Drinking Water 2015 Assessement and MDG update

Looking back on 25 years of water, sanitation and hygiene monitoring, the report  provides a comprehensive assessment of progress since 1990.  The MDG target for drinking water was achieved in 2010 but the world has missed the sanitation target by almost 700 million people. In 2015, 663 million people still lack improved drinking water sources, 2.4 billion lack improved sanitation facilities and 946 million still practice open defecation.


Web Application

JMP Progress on Sanitation and Drinking Water 2015 data dashboard

How has your country been progressing in the areas of water and sanitation? How many more people now have access to piped water and to what extent has open defecation decreased since 1990? An interactive dashboard shows the latest data at the country level on improved water and sanitation around the world from 1990–2015. Since national averages often hide differences, the data is shown as a total and also broken down by urban and rural areas. Data are drawn from the latest JMP report.


Notes on the Data

WHO/UNICEF JOINT MONITORING PROGRAMME FOR WATER SUPPLY AND SANITATION

Since 1990, WHO and UNICEF have tracked progress on global water and sanitation goals through the Joint Monitoring Programme for Water Supply and Sanitation (JMP). The JMP monitors trends in coverage; helps build national monitoring capacity in developing countries; develops and harmonises questionnaires, indicators and definitions to ensure comparability of data over time and among countries; and informs policymakers of the status of the water supply and sanitation sector through annual publications. The JMP draws guidance from a technical advisory group of leading experts in water supply, sanitation and hygiene, and from institutions involved in data collection and sector monitoring. Further information about the JMP and its methodology can be found at the JMP website.

DATA SOURCES

The JMP estimates for handwashing are based on information collected in household surveys such as Multiple Indicator Cluster Surveys (MICS) and Demographic and Health Surveys (DHS). Household surveys are usually conducted by national institutes of statistics, carried out by trained national staff who collect information on a wide range of health and living conditions through face-to-face interviews. Nationally owned and independently verifiable, these data sources provide national governments with a periodic update of the status and progress with respect to handwashing. Increasingly household survey data allow for assessing disparities in access by marginalized populations and geographic areas.

DEFINITION OF HANDWASHING FACILITIES WITH SOAP AND WATER

The presence of soap and water at a designated place is used a proxy for handwashing behaviours. Households are considered to have access if enumerators observe a place for handwashing and both water and soap are available.