This website is best viewed on modern browsers (including Internet Explorer 8.0 or higher, Chrome and Safari). Please update your browser for the best experience. X
UNICEF STATISTICS
  UNICEF Data: Monitoring the Situation of Children and Women
About this area This part of the website presents the most up-to-date data and analysis on the situation of children.

Latest publication

Statistics by Country
Current Status + Progress
Undernutrition contributes to nearly half of all deaths in children under 5 and is widespread in Asia and Africa

Nearly half of all deaths in children under 5 are attributable to undernutrition. This translates into the unnecessary loss of about 3 million young lives a year. Undernutrition puts children at greater risk of dying from common infections, increases the frequency and severity of such infections, and contributes to delayed recovery. In addition, the interaction between undernutrition and infection can create a potentially lethal cycle of worsening illness and deteriorating nutritional status. Poor nutrition in the first 1,000 days of a child’s life can also lead to stunted growth, which is irreversible and associated with impaired cognitive ability and reduced school and work performance.

Measures of child undernutrition are used to track development progress. In terms of overall progress towards the Millennium Development Goals, Sub-Saharan Africa is far behind all other regions and the furthest from reaching a 50 per cent reduction in stunting prevalence since 1990. Meanwhile, the number of overweight children worldwide – another aspect of malnutrition – is rapidly rising.

Now, in the Post-2015 development era, estimates of child malnutrition will help determine whether the world is on track to achieve the Sustainable Development Goals – particularly, Goal 2 to “end hunger, achieve food security and improved nutrition, and promote sustainable agriculture”.

Stunting

In 2014, 23.8 per cent, or just under one in four children under age 5 worldwide had stunted growth. That said, overall trends are positive. Between 1990 and 2014, stunting prevalence globally declined from 39.6 per cent to 23.8 per cent, and the number of children affected fell from 255 million to 159 million. In 2014, just over half of all stunted children lived in Asia and over one third in Africa. 

Globally, stunting declined from two in five to one in four between 1990 and 2014
Percentage of children under 5 who are stunted, by region, 1990 to 2014

* Central Eastern Europe/Commonwealth of Independent States. Due to consecutive lack of any data, results are not displayed for year 1990; the CEE/CIS region does not include Russia due to missing data; Consecutive low population coverage for the 2014 estimate (interpret with caution).

Source: UNICEF/WHO/World Bank Joint Child Malnutrition Estimates, September 2015 edition.

Explore data on malnutrition in an interactive visualization

Between 1990 and 2014, the number of stunted children under 5 worldwide declined from 255 million to 159 million. At the same time, numbers have increased at an alarming rate in West and Central Africa - from 19.9 million to 28.0 million.

Between 1990 and 2014, the number of stunted children under 5 worldwide declined from 255 million to 159 million. At the same time, numbers have increased at an alarming rate in West and Central Africa - from 19.9 million to 28.0 million
Number of children under 5 who are stunted, by region, 1990 to 2014

* Central Eastern Europe/Commonwealth of Independent States. Due to consecutive lack of any data, results are not displayed for year 1990 (1995 is presented instead); the CEE/CIS region does not include Russia due to missing data; Consecutive low population coverage for the 2014 estimate (interpret with caution).

Source: UNICEF/WHO/World Bank Joint Child Malnutrition Estimates, September 2015 edition.

Explore data on malnutrition in an interactive visualization

Underweight

Worldwide, 95 million children under age 5 were underweight in 2014. Underweight prevalence continues to decline, but at a slow pace. Between 1990 and 2014, it decreased from 25.0 per cent to 14.3 per cent of the under 5 population worldwide. Three regions, have met or exceeded the MDG target: East Asia and the Pacific, Latin America and the Caribbean, and Central and Eastern Europe and the Commonwealth of Independent States (CEE/CIS). Middle East and North Africa were very close to the target as of 2014.  West and Central Africa has experienced the smallest relative decrease, with an underweight prevalence of 22 per cent in 2014, down from 31 per cent in 1990. 

Globally, underweight prevalence continues to decline, but progress in West and Central Africa has been slow
Percentage of children under 5 who are underweight, by region, 1990 to 2014

* Central Eastern Europe/Commonwealth of Independent States. Due to consecutive lack of any data, results are not displayed for year 1990; the CEE/CIS region does not include Russia due to missing data; Consecutive low population coverage for the 2014 estimate (interpret with caution).

Source: UNICEF/WHO/World Bank Joint Child Malnutrition Estimates, September 2015 edition.

Explore data on malnutrition in an interactive visualization


Globally, the number of children suffering from underweight continues to decline; but in West and Central Africa, underweight is on the rise
Number of children under 5 who are underweight, by region, 1990 to 2014

* Central Eastern Europe/Commonwealth of Independent States. Due to consecutive lack of any data, results are not displayed for year 1990 (1995 is presented instead); the CEE/CIS region does not include Russia due to missing data; Consecutive low population coverage for the 2014 estimate (interpret with caution).

Source: UNICEF/WHO/World Bank Joint Child Malnutrition Estimates, September 2015 edition.

Explore data on malnutrition in an interactive visualization

Overweight

Worldwide, in 2014, 41 million children under age 5 were overweight, up from 31 million in 1990. Trends suggest that this number will continue to rise. The rise in overweight prevalence is reflected in almost all regions, with the greatest absolute and relative increases in CEE/CIS. While the numbers of children affected have been steady in Latin America and the Caribbean, they have been increasing since the year 2000 in all other regions. East Asia and the Pacific had the highest number of overweight children in 2014. Of particular concern is the rise in the number of both stunted and overweight children in West and Central Africa, where health-care systems are ill-equipped to manage this double – and growing – burden of malnutrition.

In most regions, the proportion of overweight children continues to rise
Percentage of children under 5 who are overweight, by region, 1990 to 2014

* * Central Eastern Europe/Commonwealth of Independent States. Due to consecutive lack of any data, results are not displayed for year 1990; the CEE/CIS region does not include Russia due to missing data; Consecutive low population coverage for the 2014 estimate (interpret with caution).

Source: UNICEF/WHO/World Bank Joint Child Malnutrition Estimates, September 2015 edition.

Explore data on malnutrition in an interactive visualization

In most regions, the number of overweight children continues to rise
Number of children under 5 (in millions) who are overweight, by region, 1990 to 2014

* Central Eastern Europe/Commonwealth of Independent States. Due to consecutive lack of any data, results are not displayed for year 1990 (1995 is presented instead); the CEE/CIS region does not include Russia due to missing data; Consecutive low population coverage for the 2014 estimate (interpret with caution).

Source: UNICEF/WHO/World Bank Joint Child Malnutrition Estimates, September 2015 edition.

Explore data on malnutrition in an interactive visualization

Wasting and Severe Wasting

In 2014 globally, 50 million children under 5 were wasted and 16 million were severely wasted. This translates into a prevalence of almost 8 per cent and just less than 3 per cent, respectively. In 2014, almost all wasted children lived in Asia (69 per cent) and Africa (29 per cent), with similar proportions for severely wasted children. At 14.9 per cent, South Asia’s wasting prevalence is close to becoming a ‘critical’ public health problem; that of West and Central Africa represents a ‘serious’ need for intervention with appropriate treatment programmes.  Under 5 wasting and severe wasting are highly sensitive to change. Thus, estimates for these indicators are only reported for current levels (2014).

The prevalence of wasting in South Asia is so severe, at just under 15 per cent, that it is approaching the level of a critical public health problem

* Central Eastern Europe/Commonwealth of Independent States. Consecutive low population coverage for the 2014 estimate, interpret with caution; due to missing data, Russia is not included.

Source: UNICEF/WHO/World Bank Joint Child Malnutrition Estimates, September 2015 edition.

Discalimer: This map is stylized and not to scale. It does not reflect a position by UNICEF on the legal status of any country or territory or the delimitation of any frontiers.

Explore data on malnutrition in an interactive visualization

Disparities

In almost all countries with available data, stunting rates are higher among boys than girls.  While analyses to determine underlying causes for this phenomenon are underway, initial review of the literature suggests that the higher risk for preterm birth among boys (which is inextricably linked with lower birth weight) is a potential reason for this sex-based disparity in stunting.

Boys are more likely to be stunted than girls in most countries
Percentage of boys under 5 who are stunted (y-axis), vs percentage of girls under 5 who are stunted (x-axis), by region, 2012

Source: UNICEF global nutrition database, 2014, based on Multiple Indicator Cluster Surveys (MICS), Demographic and Health Surveys (DHS) and other nationally representative surveys. 

Children from the poorest 20 per cent of the population are more than twice as likely to be stunted as those from the richest quintile. In South Asia, the absolute disparities between the richest and poorest children in regard to stunting are greater than in any other region. While the overall rates are lower, the relative disparities are greatest in Latin America and the Caribbean where the rate among the poorest is nearly 4 times higher than among the richest. 

The stunting rate is more than double among the poorest children when compared to the richest
Percentage of children under 5 who are stunted, by wealth quintile and by region, 2014

Analysis based on a subset of 87 countries with available data by wealth quintile groupings; regional estimates represent data from countries covering at least half of the regional population. Data are from 2008 to 2014, except for Brazil (2006), and India (2005-06). 

*Excludes China

**Excludes Russia

Source: Source: UNICEF global  database, 2015, based on Multiple Indicator Cluster Surveys (MICS), Demographic and Health Surveys (DHS) and other nationally representative surveys.

Greater progress has occurred for rural than urban children in three regions of Latin America and the Caribbean, CEE/CIS, and East Asia and the Pacific.  These three regions have also experienced the largest declines in stunting since 1990.  In other regions, progress in stunting reduction has been similar between rural and urban populations. 

Greater progress for rural than urban children in three regions, with the largest declines in stunting since around 2000
Percentage of children under age five moderately or severely stunted, by area of residence, around 2000 and 2014*

Source: UNICEF global databases, 2015, based on MICS, DHS, and other nationally representative sources.

Estimates are based on a subset of 73 countries with available data; estimates are only shown where population coverage was at least 50%. 

Around 2000 data = 1996-2003

Around 2014 data = 2008-2014; exceptions include Brazil (2006), India (2005-06) and Uzbekistan (2006)

* CEE/CIS and World excludes Russian Federation

An analysis of 54 countries with comparable trend data between around 2000 and around 2014, shows that gaps between the poorest 20 per cent and richest 20 per cent of children under five have closed by at least 20 per cent in the majority of upper-middle-income countries. However, in almost all low income countries, this gap has either remained the same, or increased. 

The rich poor gap is increasing or remaining the same in the majority of Low Income Countries with available trend data
Relative change in gap between richest and poorest for % of stunted children under-age five, between 2000 and 2014

Source: UNICEF global databases, 2015, based on Multiple Indicator Cluster Surveys (MICS), Demographic and Health Surveys (DHS), and other nationally representative sources.

REFERENCES

UNICEF, Progress for Children Beyond Averages: Learning from the MDGsNew York, 2015

Black, R.E., et al., ‘Maternal and Child Undernutrition and Overweight in Low-income and Middle-income Countries’, Lancet, vol. 382, no. 9890, 3 August 2013, pp. 427–451.

Blencowe H et al. (2013). Preterm birth–associated neurodevelopmental impairment estimates at regional and global levels for 2010. Pediatric Research Volume 74: No s1, December 2013.

de Onis, Mercedes, et al., 'Comparison of the World Health Organization (WHO) Child Growth Standards and the National Center for Health Statistics/WHO International Growth Reference: Implications for child health programmes’, Public Health Nutrition, vol. 9, no. 7, 2006, pp. 942–947.

de Onis, Mercedes, et al., 'Estimates of Global Prevalence of Childhood Underweight in 1990 and 2015', JAMA, vol. 291, 2004, pp. 2600–2606.

UNICEF, Improving Child Nutrition: The achievable imperative for global progress, UNICEF, New York, 2013.

UNICEF, 'Technical Note: Age-adjustment of child anthropometry estimates', UNICEF, New York, 2010.

UNICEF, 'Technical Note: How to calculate average annual rate of reduction (AARR) of underweight prevalence', UNICEF, New York, 2007.

Access The Data
Nutritional Status
Stunting Disparities by Residence and Wealth Quintile Download Data
Joint Malnutrition dataset from UNICEF, World Bank and WHO Download Data
Recent Resources
Sort by: Date | Type
Publication

Improving Child Nutrition: The achievable imperative for global progress

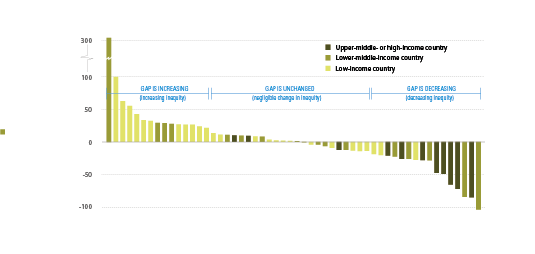
This report builds on earlier findings on the impact of undernutrition by highlighting new developments and demonstrating that efforts to scale up nutrition programmes are working, benefiting children in many countries.


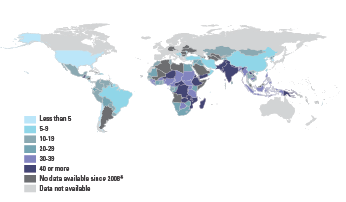
Child nutrition interactive dashboard: 2015 edition

The UNICEF-WHO-World Bank Group Child Malnutrition Dashboard allows users to generate a variety of graphs and charts, using the newest joint estimates for child malnutrition. Estimates of prevalence and numbers for child stunting, underweight, overweight and wasting are presented for the 1990 to 2014 period by the Agency Classifications of United Nations, Millennium Development Goal, UNICEF regions, WHO regions, World Bank income groups and World Bank regions.


Brochure

Levels and Trends in Child Malnutrition: 2015 edition

In September 2015, UNICEF, WHO and World Bank Group released an updated joint dataset on child malnutrition indicators (stunting, wasting, severe wasting, overweight and underweight) and new global & regional estimates covering the 1990 to 2014 period. This summary note presents key messages and highlights refinements to the method.


Notes on the Data

INDICATORS

Indicator name

Definition

Numerator

Denominator

Stunting

Number of under-fives falling below minus 2 standard deviations (moderate and severe) and minus 3 standard deviations (severe) from the median height-for-age of the reference population

Children under 5 years of age in the surveyed population

Underweight

Number of under-fives falling below minus 2 standard deviations (moderate and severe) and minus 3 standard deviations (severe) from the median weight-for-age of the reference population

Children under 5 years of age in the surveyed population

Wasting

Number of under-fives falling below minus 2 standard deviations (moderate and severe) and minus 3 standard deviations (severe) from the median weight-for-height of the reference population

Children under 5 years of age in the surveyed population

Overweight

Number of under-fives above 2 standard deviations from the median weight-for-height of the reference population

Children under 5 years of age in the surveyed population


REFERENCE POPULATION

Prevalence of underweight, stunting and wasting among children under 5 is estimated by comparing actual measurements to an international standard reference population. In April 2006, the World Health Organization released the WHO Child Growth Standards to replace the widely used National Center for Health Statistics (NCHS)/WHO reference population, which was based on a limited sample of children from the United States of America. The new standards are the result of an intensive study project involving more than 8,000 children from Brazil, Ghana, India, Norway, Oman and the United States. Overcoming the technical and biological drawbacks of the old reference population, the new standards confirm that children born anywhere in the world and given the optimum start in life have the potential to reach the same range of height and weight. It follows that differences in children's growth to age 5 are more influenced by nutrition, feeding practices, environment and health care than by genetics or ethnicity.

The new standards should be used in future assessments of child nutritional status. It should be noted that because of the differences between the old reference population and the new standards, prevalence estimates of child anthropometry indicators based on these two references are not readily comparable. It is essential that all estimates are based on the same reference population (preferably the new standards) when conducting trend analyses.

ADJUSTING COUNTRY-LEVEL ESTIMATES

Before conducting trend analyses of child nutritional status, it is important to ensure that estimates from various data sources are comparable over time. For example, household surveys in some countries in the early 1990s only collected child anthropometry information among children up to 47 months of age – or even up to only 35 months of age. Prevalence estimates based on such data only referred to children under 4 or under 3 years of age and are not comparable to prevalence estimates based on data collected from children up to 59 months of age. Some age adjustment needs to be applied to make these estimates based on non-standard age groups comparable to those based on the standard age range. For more information about age adjustment, please click here to read a technical note. In addition, prevalence estimates need to be calculated according to the same reference population. Those calculated according to the WHO Child Growth Standards are not comparable to those calculated according to the NCHS/WHO reference population. For more information about the difference between the two references and its implications, please click here to read a technical note.

ESTIMATING COUNTRY-LEVEL PROGRESS

Country-level progress in reducing undernutrition prevalence is evaluated by calculating the average annual rate of reduction (AARR) and comparing this to the AARR needed in order to be able to reduce prevalence by half over 25 years. For more information about how to calculate country-level AARR, please click here to read a technical note.

ESTIMATING REGIONAL TRENDS BY MULTILEVEL MODELLING

Estimation of regional and global trends has been based on a multilevel modelling method (see de Onis et al. in JAMA, 2004). For the most recent trend analysis presented below, a total of 716 data points from 145 countries over the period 1985 to 2013 were included in the model. This set of trend data points was jointly reviewed by UNICEF and WHO in June and July 2014 to ensure that it is nationally representative of under-five children, processed using standard algorithms and comparable vertically and horizontally. Regional trend modelling and graphing were carried out using STATA 11 on two ‘do’ files (the data set and do files are available on request).

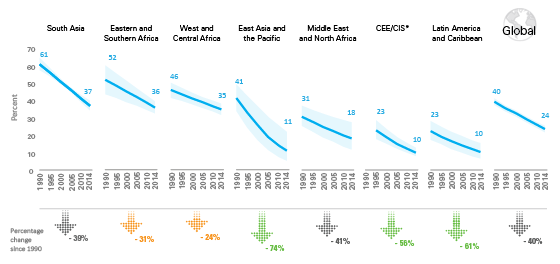
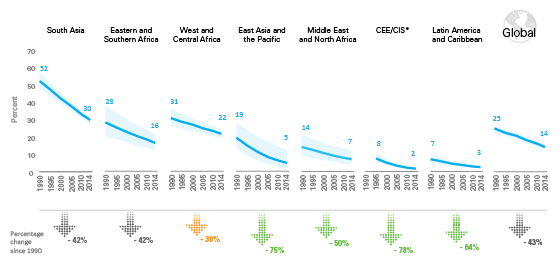
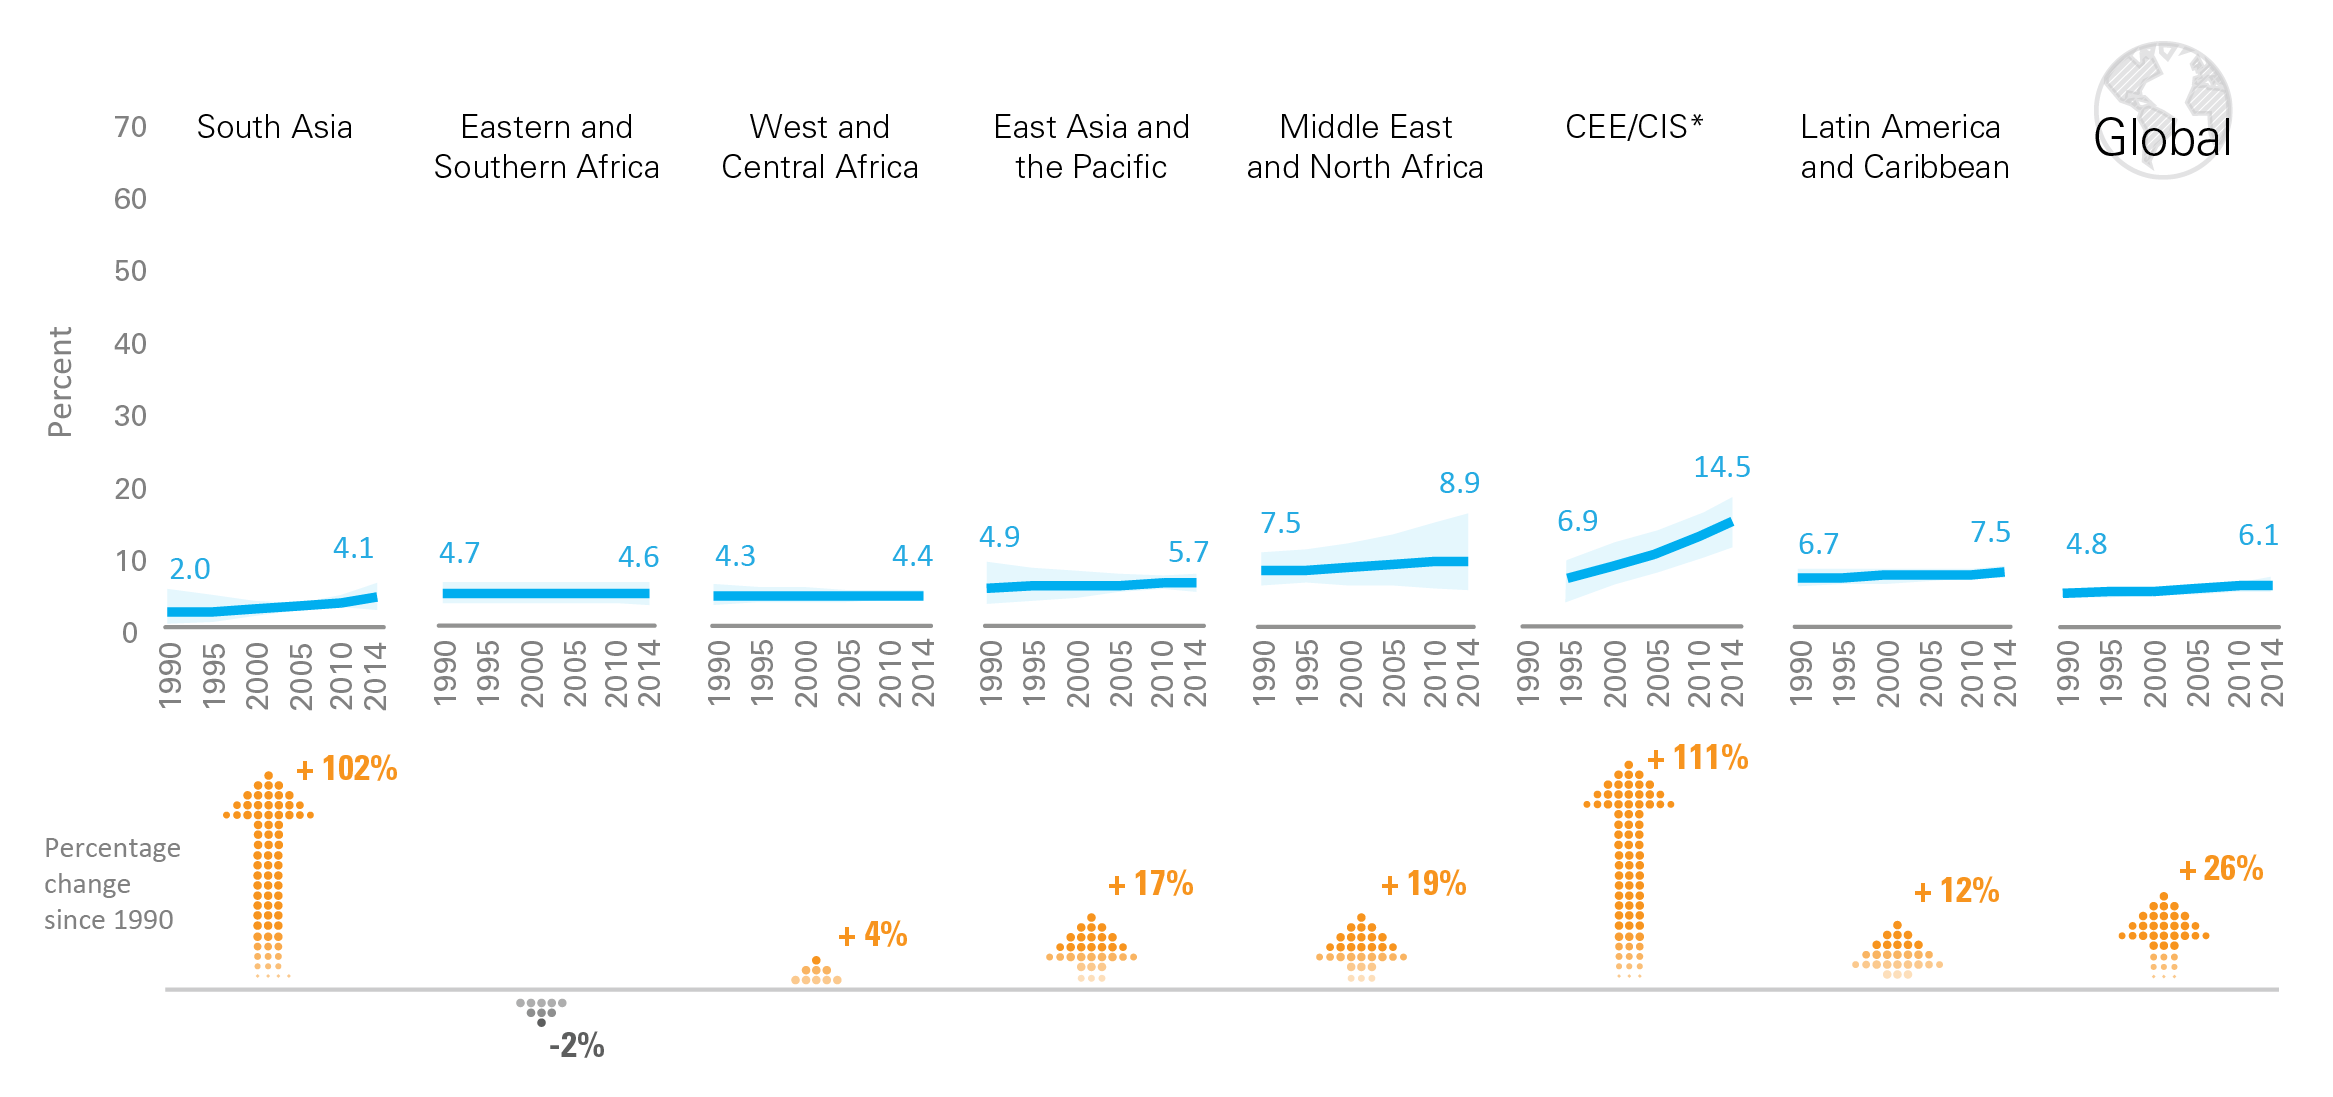
Model-based trend analysis of underweight prevalence (percentage), by region

Note: * CEE/CIS: Central and Eastern Europe and the Commonwealth of Independent States.

How to read this chart:

Each circle (bubble) represents a prevalence estimate from a country in a data year. The size of the circle is proportional to the under-five population in that country in the data year. For each region, a solid line indicates the regional trend as modelled by the multilevel logit regression on all the available data points in the region. The dashed lines in each region indicate the lower and upper bounds of the regional trend line corresponding to the confidence interval of the estimated trend.

Click here for a higher-resolution version of the above chart.