This website is best viewed on modern browsers (including Internet Explorer 8.0 or higher, Chrome and Safari). Please update your browser for the best experience. X
UNICEF STATISTICS
  UNICEF Data: Monitoring the Situation of Children and Women
About this area This part of the website presents the most up-to-date data and analysis on the situation of children.

Latest publication

Statistics by Country
Current Status + Progress
Despite major progress, the full potential of immunization continues to elude many of the world’s children

Immunization is one of the most cost-effective public health interventions to date, saving millions of lives1 and protecting countless children from illness and disability. As a direct result of immunization, polio is on the verge of eradication. Deaths from measles, a major child killer, declined by 71 per cent worldwide and by 80 per cent in sub-Saharan Africa between 2000 and 2011.2 And 35 of 59 priority countries have eliminated maternal and neonatal tetanus. 

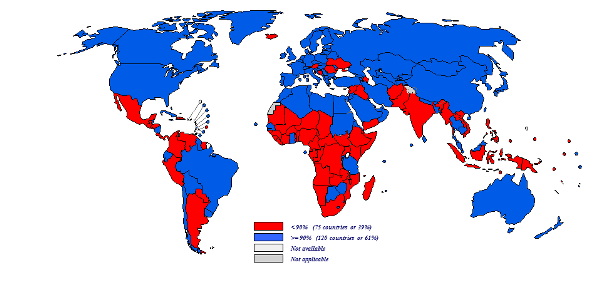
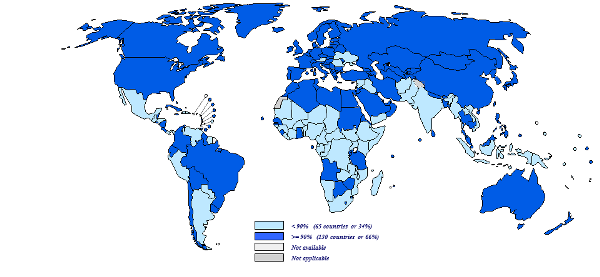
Immunization has not yet realized its full potential, however. As of end-2013, 21.8 million children under 1 year of age worldwide had not received the three recommended doses of vaccine against diphtheria, tetanus and pertussis containing vaccine (DTP3), and 21.6 million children in the same age group had failed to receive a single dose of measles-containing vaccine. Given an estimated annual cohort of 133.6 million surviving infants, an additional 11.2 million children would need to have been reached during 2013 to attain 90% DTP3 coverage globally.  

Immunization is an affordable means of protecting whole communities from disease and reducing poverty. Immunization coverage for the six major vaccine-preventable diseases – pertussis, childhood tuberculosis, tetanus, polio, measles and diphtheria – has risen significantly since the Expanded Programme on Immunization began in 1974. 

An increasing number of countries are now offering pneumococcal conjugate vaccine and rotavirus vaccine in their immunization programmes, thus offering protection against pneumonia and diarrhoea. Use of underutilized vaccines, such as those against yellow fever and Japanese encephalitis, has also been expanded. UNICEF and the World Health Organization (WHO) have broadened their monitoring process accordingly to include coverage of all of these vaccines.

Global coverage of three doses of DTP-containing vaccine has more than quadrupled since 1980, and now stands at 84 per cent
Global coverage (percentage) of three doses of DTP-containing vaccine, 1980─2013

WHO and UNICEF estimates of national immunization coverage, 2013 revision (completed July 2014).

ROUTINE IMMUNIZATION COVERAGE    

The percentage of children receiving DTP3 is often used as an indicator of how well countries are providing routine immunization services. Global coverage for three doses of DTP-containing vaccine increased from 20 per cent in 1980 to 73 per cent in 2000 to an estimated 84 per cent by the end of 2013. 

120 countries achieved and sustained coverage of at least 90 per cent with three doses of DTP-containing vaccine during 2011–2013
Sustained coverage with three doses of DTP-containing vaccine of at least 90 per cent, 2011–2013

WHO and UNICEF estimates of national immunization coverage, 2013 revision (completed July 2014).

Despite these advances, many more children could be receiving the benefits of immunization. Of the 21.8 million children worldwide who have not received three doses of DTP-containing vaccine, 75 per cent live in just 15 countries. Absolute numbers of unvaccinated infants are highest in the most populous developing countries, some of which enjoy fairly high rates of immunization coverage. Efforts to raise global immunization levels will require a strong focus on the countries where the highest numbers of unvaccinated children live – while also ensuring that the countries where children are most likely to miss out on immunization are not neglected in the search for greater global impact.

Nearly three quarters of the children who have not received three doses of DTP-containing vaccine during 2013 live in 15 countries
Global distribution of the number of children who did not receive three doses of DTP-containing vaccine during 2013 (millions)

Source: WHO and UNICEF estimates of national immunization coverage, 2013 revision (completed July 2014). Population data for children surviving to 1 year of age obtained from: United Nations, Department of Economic and Social Affairs, Population Division, World Population Prospects: The 2012 revision, United Nations, New York, 2013.

THE GOAL: UNIVERSAL ACCESS

The Global Vaccine Action Plan was endorsed by 194 Member States of the World Health Assembly in May 2012 to achieve the vision of universal access to immunization outlined in the Decade of Vaccines. The action plan is a framework to prevent millions of deaths by 2020 and beyond by:

  • Strengthening routine immunization to meet vaccination coverage targets
  • Accelerating control of vaccine-preventable diseases with polio eradication as the first milestone
  • Introducing new and improved vaccines
  • Spurring research and development for the next generation of vaccines and technologies.

Progress on the Global Vaccine Action Plan is reported annually to the World Health Assembly and began in 2014.

The Global Vaccine Action Plan builds on the Global Immunization Vision and Strategy 2006─2015, developed by UNICEF, WHO and partners to assist countries in expanding the reach of immunization to every eligible person, including those in age groups beyond infancy. One of its goals is to increase national immunization coverage to at least 90 per cent by 2010 and to sustain such levels through 2015.During 2013, seven of 195 countries had an estimated DTP3 coverage less than 50 per cent, while 130 countries achieved at least 90 per cent coverage with three doses of DTP containing vaccine. Of these 130 countries, 120 had sustained DTP3 coverage of at least 90 per cent during 2011–2013.

130 countries achieved coverage of at least 90 per cent with three doses of DTP-containing vaccine during 2013
Coverage with three doses of DTP-containing vaccine of at least 90 per cent, 2013

WHO and UNICEF estimates of national immunization coverage, 2013 revision (completed July 2014).

For further details on the Global Vaccine Action Plan and current progress, visit the GVAP Secretariat.


FUTURE DIRECTIONS

Gavi, the Vaccine Alliance (formerly known as the GAVI Alliance and the Global Alliance for Vaccines and Immunization) has developed financial sustainability plans for countries eligible for support. But mobilizing and securing adequate funding will also require stronger political will, better management and greater advocacy.

Increases in routine coverage and improved availability of new vaccines can succeed in reducing child deaths, even in the poorest countries and under difficult circumstances. Strategies to reach every district include re-establishing outreach services, building district-level micro-planning, providing supportive supervision and linking communities with services.

Campaigns such as those for polio eradication and measles mortality reduction have helped strengthen the cold chain and injection safety. Support from GAVI for the introduction of new vaccines, including training, demand-creation and cold-chain expansion, are helping boost immunization activities.

Greater attention is also being focused on improving the availability, retention and utilization of home-based vaccination records. Home-based vaccination records play an important role in documenting immunization services received by individuals (1). A home-based vaccination record is a document (more often physical than electronic) — issued to an individual person by an official authority such as a national, provincial or district health department and retained by the individual or their caregiver — on which an individual’s history of vaccinations received from all health care providers, through routine immunization and supplementary immunization activities, is recorded. Home-based records foster coordination and continuity of immunization service delivery between service providers, facilitate communication between health workers and caregivers and support public health monitoring. When properly used, home-based records provide a relatively inexpensive and effective instrument for promoting childhood immunization, educating caregivers about their child’s immunization status and stimulating demand for services. Unfortunately, the child immunization card is often underutilized or misused by parents and health workers and does not always fulfil its intended purpose. UNICEF and WHO in collaboration with partners are working with national immunization programmes to improve the availability, utilization and retention of vaccination cards ultimately will lead to improvements in immunization data quality. An online library, www.immunizationcards.org, has been established to facilitate review and exchange of information on existing vaccination and child health cards, and a website has been developed to monitor the prevalence of vaccination cards through household surveys.


REFERENCES

  1. Levine, O.S., et al., ‘The Future of Immunisation Policy, Implementation, and Financing’, Lancet, vol. 378, 2011, pp. 439─448.  
  2. Updated measles mortality estimates data through 2011 were obtained from Dr. Robert Perry, WHO, Geneva, Switzerland, based on a model reported in: Simons, E., et al., ‘Assessment of the 2010 Global Measles Mortality Reduction Goal: Results from a model of surveillance data’, Lancet , vol. 379, 2012, pp. 2173–2178.
Access The Data
Immunization Coverage and System Performance Indicator Data
Immunization coverage by antigen (including trends) Download Data
System Performance Indicator Data: WHO and UNICEF coverage estimates with data for all years since 1980, plus reported data that include district-level performance indicators and national immunization schedules Download Data
System Performance Indicator Survey Data Download Data
Sample of the WHO/UNICEF Joint Reporting Form on Immunization in English Download Data
Sample of the WHO/UNICEF Joint Reporting Form on Immunization in Spanish Download Data
Sample of the WHO/UNICEF Joint Reporting Form on Immunization in French Download Data
Recent Resources
Sort by: Date | Type
Publication

Immunization Summary: A statistical reference containing data through 2013

This immunization summary is a statistical reference containing data through 2013. It was jointly produced by the United Nations Children’s Fund (UNICEF) and the World Health Organization (WHO). It presents detailed statistics on the performance of national and district-level immunization systems in 195 countries and territories. 


Web Application

Immunization Coverage Summary Application

The Immunization Summary is an app for visualizing (tables, graphs, maps) data on policies, activities and impact of national immunization systems.

These data are reported by WHO & UNICEF member states annually for incidence, coverage and immunization indicators;

The WHO UNICEF estimates of national immunization coverage constitute an independent technical assessment of coverage;

The population data are provided by the United Nations’ “Population Division. The World Population Prospects - the 2012 revision. New York, 2013.” With the exception of the infant and child mortality figures which are provided by WHO’s “World Health Statistics 2013, data for 2012.”

The GNI & GDP data are taken from "The 2013 World Bank Development Indicators Online".

Data are available from 1980 to 2013 (as of 14 July 2014) for a 195 countries or territories.


Journal Article

Global Routine Vaccination Coverage, 2013

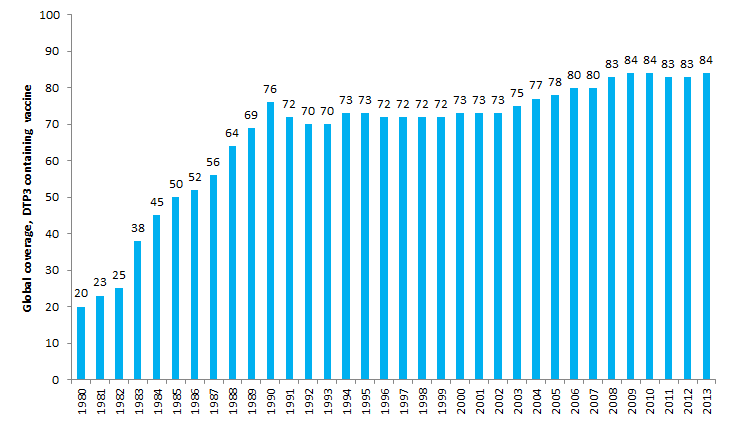
In 1974, the World Health Organization (WHO) established the Expanded Program on Immunization to ensure that all children have access to routinely recommended vaccines. Since then, global coverage with the four core vaccines (Bacille Calmette-Guérin vaccine [for protection against tuberculosis], diphtheria-tetanus-pertussis vaccine [DTP], polio vaccine, and measles vaccine) has increased from <5% to ≥84%, and additional vaccines have been added to the recommended schedule. Coverage with the third dose of DTP vaccine (DTP3) by age 12 months is a key indicator of immunization program performance. Estimated global DTP3 coverage has remained at 83%-84% since 2009, with estimated 2013 coverage at 84%. Global coverage estimates for the second routine dose of measles-containing vaccine (MCV2) are reported for the first time in 2013; globalcoverage was 35% by the end of the second year of life and 53% when including older age groups. Improvements in equity of access and use ofimmunization services will help ensure that all children are protected from vaccine-preventable diseases.

Harris JB, Gacic-Dobo M, Eggers R, Brown DW, Sodha SV. Global Routine Vaccination Coverage, 2013. MMWR Morb Mortal Wkly Rep. 2014;63(46):1055-1058.


Journal Article

Results from a survey of national immunization programmes on home-based vaccination record practices in 2013

During January 2014, WHO and the United Nations Children's Fund sent a one-page questionnaire to 195 countries to obtain information on HBRs including type of record used, number of records printed, whether records were provided free-of-charge or required by schools, whether there was a stock-out and the duration of any stock-outs that occurred, as well as the total expenditure for printing HBRs during 2013.


Journal Article

Home-based record prevalence among children aged 12-23 months from 180 demographic and health surveys

There is currently a re-focus at the global level on the importance of the home-based record within vaccination service delivery as an important information resource but there are few reports of ever and current home-based record prevalence across countries. We considered all Demographic and Health Surveys (starting with DHS round 3) conducted between 1993 and 2013 for which a final dataset was available in the public domain at the time of the analysis.

An electronic copy of the manuscript is available upon request. Please contact us with your requests here


Country Specific Reports and Notes on the Data

Country-specific reports of the WHO and UNICEF estimates of national immunization coverage

The graphs and data tables displayed in the country-specific reports show the national coverage levels for each vaccine for the period from 2002 through 2013 (see guide). Owing to evolving methodology and revisions of the time series, the data in each revision supersede all historical data previously published.

To access country data please click on country name

Central and Eastern Europe and the Commonwealth of Independent States

Albania

Georgia

Serbia

Armenia

Kazakhstan

Tajikistan

Azerbaijan

Kyrgyzstan

The former Yugoslav Republic of Macedonia

Belarus

Montenegro

Turkey

Bosnia and Herzegovina

Republic of Moldova

Turkmenistan

Bulgaria

Romania

Ukraine

Croatia

Russian Federation

Uzbekistan


East Asia and the Pacific

Brunei Darussalam

Lao People’s Democratic Republic

Palau

Timor-Leste

Cambodia

Malaysia

Papua New Guinea

Tonga

China

Marshall Islands

Philippines

Tuvalu

Cook Islands

Micronesia (Federated States of)

Republic of Korea

Vanuatu

Democratic People’s Republic of Korea

Mongolia

Samoa

Viet Nam

Fiji

Myanmar

Singapore


Indonesia

Nauru

Solomon Islands


Kiribati

Niue

Thailand


Eastern and Southern Africa

Angola

Kenya

Namibia

Swaziland

Botswana

Lesotho

Rwanda

United Republic of Tanzania

Burundi

Madagascar

Seychelles

Uganda

Comoros

Malawi

Somalia

Zambia

Eritrea

Mauritius

South Africa

Zimbabwe

Ethiopia

Mozambique

South Sudan


Industrialized countries

Andorra

France

Lithuania

Slovakia

Australia

Germany

Luxembourg

Slovenia

Austria

Greece

Malta

Spain

Belgium

Hungary

Monaco

Sweden

Canada

Iceland

Netherlands

Switzerland

Cyprus

Ireland

New Zealand

United Kingdom

Czech Republic

Israel

Norway

United States

Denmark

Italy

Poland


Estonia

Japan

Portugal


Finland

Latvia

San Marino


Latin America and the Caribbean

Antigua and Barbuda

Costa Rica

Haiti

Saint Lucia

Argentina

Cuba

Honduras

Saint Vincent and the Grenadines

Bahamas

Dominica

Jamaica

Suriname

Barbados

Dominican Republic

Mexico

Trinidad and Tobago

Belize

Ecuador

Nicaragua

Uruguay

Bolivia (Plurinational State of)

El Salvador

Panama

Venezuela (Bolivarian Republic of)

Brazil

Grenada

Paraguay


Chile

Guatemala

Peru


Colombia

Guyana

Saint Kitts and Nevis


Middle East and North Africa

Algeria

Jordan

Qatar

United Arab Emirates

Bahrain

Kuwait

Saudi Arabia

Yemen

Djibouti

Lebanon

State of Palestine


Egypt

Libya

Sudan


Iran (Islamic Republic of)

Morocco

Syrian Arab Republic


Iraq

Oman

Tunisia


South Asia

Afghanistan

Maldives

Bangladesh

Nepal

Bhutan

Pakistan

India

Sri Lanka


West and Central Africa

Benin

Democratic Republic of the Congo

Mali

Burkina Faso

Equatorial Guinea

Mauritania

Cabo Verde

Gabon

Niger

Cameroon

Gambia

Nigeria

Central African Republic

Ghana

Sao Tome and Principe

Chad

Guinea

Senegal

Congo

Guinea-Bissau

Sierra Leone

Côte d'Ivoire

Liberia

Togo


Since June 2000, WHO and UNICEF have conducted annual reviews of national immunization coverage. Immunization coverage estimates are used for a variety of purposes: to monitor the performance of immunization services at local, national and international levels; to guide polio eradication, measles control and maternal and neonatal tetanus elimination; to identify areas of weak system performance that may require extra resources and focused attention; and as one indicator when deciding whether to introduce a new vaccine. Coverage levels with diphtheria-tetanus-pertussis-containing vaccine (DTP) are considered one indicator of health system performance.

A detailed explanation of the methods behind the WHO and UNICEF estimates of national immunization coverage is provided elsewhere.1,2,3,4 Estimates of immunization coverage are generally based on two sources of empirical data: reports of vaccinations performed by service providers (administrative data5) and household surveys containing items on children's vaccination history (coverage surveys).  For estimates based on administrative data, the immunization coverage is derived by dividing the total number of vaccinations given by the number of children in the target population.  For most vaccines the target population is the national annual number of births or number of surviving infants (this may vary depending on countries' policies and the specific vaccine). Immunization coverage surveys are frequently used in connection with administrative data. The Expanded Programme on Immunization (EPI) 30-cluster survey, the UNICEF-supported Multiple Indicator Cluster Surveys (MICS) and the Demographic Health Surveys (DHS) supported by the United States Agency for International Development are the principal surveys used as sources of information on immunization coverage.

This review relies on the following data:

  • Officially reported data by WHO and UNICEF Member States
  • A historical database maintained by UNICEF
  • Nationally representative, population-based household survey reports (published and unpublished).

It is important to distinguish whether data accurately reflect immunization system performance or whether they are compromised and thus present a misleading view of immunization coverage.  Officially reported data are therefore compared with independent surveys.  Based on the data available, the consideration of potential biases and the contributions of local experts, the most likely level of immunization coverage is determined for each country–year–antigen combination.  An essential part of this review is consultation and collaboration with national authorities, who are asked to review the draft estimates and provide comments.

  1. Burton, A., et al., ’A Formal Representation of the WHO and UNICEF Estimates of National Immunization Coverage: A computational logic approach’, PLOS ONE, vol. 7, no. 10:e47806, 2012.
  2. Kowalski R., A. Burton, ’WUENIC – A Case Study in Rule-based Knowledge Representation and Reasoning’, Lecture Notes in Computer Science, vol. 7258, 2012, pp. 112─125.
  3. Burton, A., et al., WHO and UNICEF Estimates of National Infant Immunization Coverage: Methods and processes, Bulletin of the World Health Organization, vol. 87, 2009, pp. 535─541. 
  4. Brown DW, Burton AH, Gacic-Dobo M, Karimov RI. An Introduction to the Grade of Confidence Used to Characterize Uncertainty Around the WHO and UNICEF Estimates of National Immunization Coverage. Open Public Hlth J. 2013;6:73-76.
  5. Administrative data are collected through the WHO/UNICEF Joint Reporting Form on Vaccine-Preventable Diseases, completed annually by countries.


ImmunizationInfo: Expanding access to national immunization coverage estimates

The data above can also be viewed through ImmunizationInfo, an interactive online dissemination tool of national childhood immunization coverage statistics developed in 2010 by UNICEF and WHO in collaboration with Community Systems Foundation.  ImmunizationInfo is powered by DevInfo database technology and built using Adobe-Flex technology and allows users to view national immunization coverage estimates in graph, map and table formats based on a user-defined selection of country-year-vaccine combinations. Users can generate comparative graphs and also download the underlying data.