


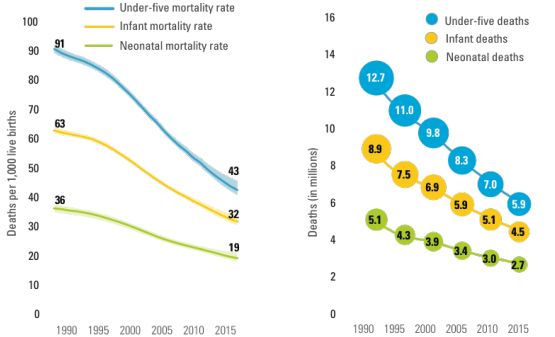
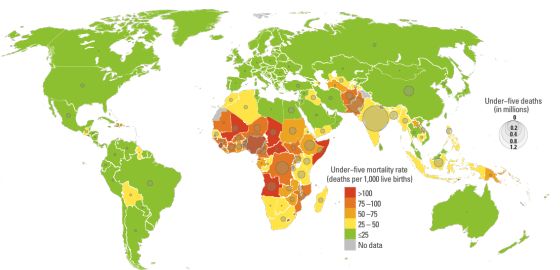
Since 1990, the world has cut both the rate and number of child deaths by more than one half. This progress, while remarkable, falls short of the Millennium Development Goal 4 (MDG 4) target of a two-thirds reduction in the under-five mortality rate. In 2015, an estimated 5.9 million children under the age of five will still die, equivalent to 11 every minute. This underscores that child survival needs to be a continued priority when we look beyond the MDGs.
Committing to Child Survival: A Promise Renewed - Progress Report 2014
This report looks at causes of death and coverage of key interventions for mother and newborn and highlights initiatives by governments, civil society and the private sector to accelerate progress on child survival.

Levels and Trends in Child Mortality Report 2014
Recent estimates show that the number of under-five deaths worldwide has declined by half since 1990, from 12.7 million to 6.3 million today. Yet, 17,000 children under age five still die every day in 2013.


UNICEF Report: enormous progress in child survival but greater focus on newborns urgently needed
Reproductive Health, vol. 11, no.8, 2014, pp.1-4.

Levels and Trends in Child Mortality 2015
This report presents the group’s latest estimates of under-five, infant and neonatal mortality up to the year 2015, and assesses progress at the country, regional and global levels. The report also provides an overview on the estimation methods used for child mortality indicators.
rnrnrn

Committing to Child Survival: A Promise Renewed 2015
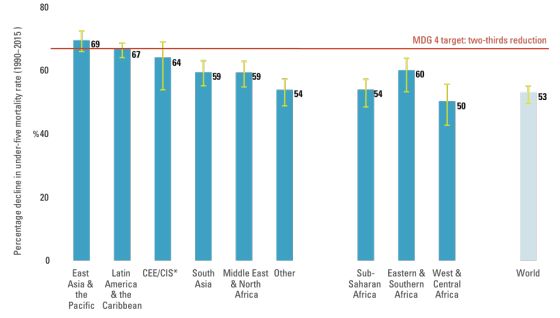
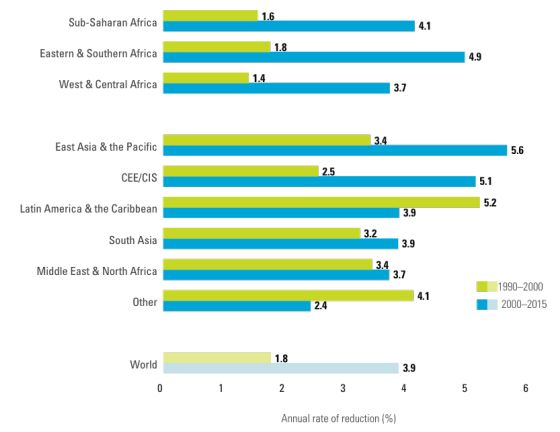
Since its initiation, A Promise Renewed has focused on promoting two goals: first, keeping the promise of Millennium Development Goal (MDG) 4 – to reduce the under-five mortality rate by two thirds, between 1990 and 2015; and second, continuing the fight beyond 2015, until no child or mother dies from preventable causes. By focusing on priority actions and core principles, countries are already achieving progress, bending the curve on child mortality and moving towards a world where no mother or child dies from a preventable cause. As we begin the work of the Sustainable Development Goals, maintaining this momentum must be our top priority
rn
Global, regional, and national levels and trends in under-5 mortality between 1990 and 2015, with scenario-based projections to 2030: a systematic analysis by the UN Inter-agency Group for Child Mortality Estimation
In 2000, world leaders agreed on the Millennium Development Goals (MDGs). MDG 4 called for a two-thirds reduction in the under-5 mortality rate between 1990 and 2015. The report aims to estimate levels and trends in under-5 mortality for 195 countries from 1990 to 2015 to assess MDG 4 achievement and then intended to project how various post-2015 targets and observed rates of change will affect the burden of under-5 deaths from 2016 to 2030.
DEFINITION OF INDICATORS
Under-five mortality rate: Probability of dying between birth and exactly 5 years of age, expressed per 1,000 live births.
Infant mortality rate: Probability of dying between birth and exactly 1 year of age, expressed per 1,000 live births.
Neonatal mortality rate: Probability of dying during the first 28 days of life, expressed per 1,000 live births.
DATA SOURCES AND METHODOLOGY
If each country had a single source of high-quality data covering the last few decades, reporting on child mortality levels and trends would be straightforward. But few countries do, and the limited availability of high-quality data over time for many countries makes generating accurate estimates of child mortality a considerable challenge.
Nationally representative estimates of child mortality can be derived from several sources, including civil registration, censuses and sample surveys. Demographic surveillance sites and hospital data are excluded because they are rarely representative. The preferred source of data is a civil registration system that records births and deaths on a continuous basis, collects information as events occur and covers the entire population. If registration coverage is complete and the systems function efficiently, the resulting child mortality estimates will be accurate and timely. However, many countries remain without viable or fully functioning vital registration systems that accurately record all births and deaths—only around 60 countries have such systems. Therefore, household surveys, such as the UNICEF-supported Multiple Indicator Cluster Surveys and the US Agency for International Development–supported Demographic and Health Surveys, which ask women about the survival of their children, are the basis of child mortality estimates for most developing countries.
The United Nations Inter-agency Group for Child Mortality Estimation (UN IGME) seeks to compile all available national-level data on child mortality, including data from vital registration systems, population censuses, household surveys and sample registration systems. To estimate the under-five mortality trend series for each country, a statistical model is fitted to data points that meet quality standards established by IGME and then used to predict a trend line that is extrapolated to a common reference year, set at 2015 for the estimates presented here. Infant mortality rates are generated by either applying a statistical model or transforming under-five mortality rates based on model life tables. Neonatal mortality rates are produced using a statistical model that uses under-five mortality rates as input. These methods provide a transparent and objective way of fitting a smoothed trend to a set of observations and of extrapolating the trend from the earliest available data point to the present.
An overview on the methodology is available in this year’s UN IGME report
A peer-reviewed collection of articles that makes a vital contribution to transparency on UN IGME's methodology for child mortality estimation.
Topics include: an overview of the child mortality estimation methodology developed by UN IGME, methods used to adjust for bias due to AIDS, estimation of sex differences in child mortality, and more. The collection was produced with support from UNICEF and the independent technical advisory group of IGME Read more.
CHANGE IN ESTIMATION PROCESS
The UN IGME continually seeks to improve its methods. Since 2013, estimates and projections of under-five mortality have been produced using the Bayesian B-splines bias-adjusted model, referred to as the B3 model. Compared with the previously applied Loess estimation approach the B3 model better accounts for data errors, including biases and sampling and nonsampling errors in the data. It can better capture short-term fluctuations in the under-five mortality rate and its annual rate of reduction and thus is better able to account for evidence of acceleration in the decline of under-five mortality from new surveys. Validation exercises show that the B3 model also performs better in short-term projections.
Estimates of infant mortality rates are generated by applying the B3 model for countries with high-quality vital registration data. For other countries, infant mortality rates are derived from under-five mortality rates using model life tables that contain known regularities in age patterns of child mortality. This approach ensures that the internal relationships of the two indicators are consistent with established norms. Estimates of neonatal mortality rates are produced using a statistical model that uses under-five mortality rates as an input. These methods provide a transparent and objective way of fitting a smoothed trend to a set of observations and of extrapolating the trend to the present.
In 2012 the UN IGME produced sex-specific estimates of the under-five mortality rate for the first time. In many countries fewer sources provide data disaggregated by sex than for both sexes combined. So the UN IGME uses the available data by sex to estimate a time trend in the sex ratio (male–female) of child mortality rather than estimating child mortality trends by sex directly from reported mortality levels by sex. Since 2013 a Bayesian model developed by the UN IGME has been used to estimate sex ratios of child mortality, with a focus on identifying countries with outlying levels or trends.
In 2015 the UN IGME method for estimating NMR were updated. The new Bayesian methodology is similar to that used to estimate U5MR and estimates by sex. It has the advantage that, compared to the previous model, it can capture data-driven trends in NMR within countries and over time for all countries.
More details on the data used in deriving estimates are available in CME Info http://www.childmortality.org.
RECENT RESOURCES
UNICEF, Committing to Child Survival: A Promise Renewed. Progress Report 2015, New York, 2015.
United Nations Inter-agency Group for Child Mortality Estimation, Levels and Trends in Child Mortality: Report 2015, New York, 2015.
KEY REFERENCES
-
For a detailed description of the B3 methodology, see Alkema, L. and New, J.R. (2014). ‘Global estimation of child mortality using a Bayesian B-spline bias-reduction method’, Annals of Applied Statistics, Vol. 8, No. 4, 2122-2149. Available at http://arxiv.org/abs/1309.1602 [PDF].
- Full details of the methodology used in the estimation of child mortality for 2015 are available in the PLOS Medicine Collection on Child Mortality Estimation methods (www.ploscollections.org/childmortalityestimation).
-
For changes to methods used for the 2013 estimates, refer to UN IGME Inter-agency Levels and Trends in Child Mortality: Report 2015.
- For changes to data and methods used for the 2010 estimates click here.
- For detailed information on the methodology used for the 2009 estimates, click Estimation Methods used by the United Nations Inter-agency Group for Child Mortality Estimation.
- The full details of the methodology used in the estimation of infant and under-five mortality rates for 2006 are available in the following working paper: UNICEF, WHO, The World Bank and UN Population Division, Levels and Trends of Child Mortality in 2006: Estimates developed by the Inter-agency Group for Child Mortality Estimation’, New York, 2007. Working Paper [PDF]
Other references include:
Hill, K., et al., Trends in Child Mortality in the Developing World: 1960-1996 [Full publication [zip].
Alkema, L. et al., ‘National, regional, and global sex ratios of infant, child, and under-5 mortality and identification of countries with outlying ratios: a systematic assessment’, The Lancet Global Health, vol. 2, 9, 1 September 2014, pp. e521-e530, DOI: 10.1016/S2214-109X(14)70280-3
United Nations Inter-agency Group for Child Mortality Estimation, Levels and Trends in Child Mortality: Report 2014.
United Nations Inter-agency Group for Child Mortality Estimation, Levels and Trends in Child Mortality: Report 2013.
United Nations Inter-agency Group for Child Mortality Estimation, Levels and Trends in Child Mortality: Report 2012.
United Nations Inter-agency Group for Child Mortality Estimation, Levels and Trends in Child Mortality: Report 2011.
United Nations Inter-agency Group for Child Mortality Estimation, Levels and Trends in Child Mortality: Report 2010.