This website is best viewed on modern browsers (including Internet Explorer 8.0 or higher, Chrome and Safari). Please update your browser for the best experience. X
UNICEF STATISTICS
  UNICEF Data: Monitoring the Situation of Children and Women
About this area This part of the website presents the most up-to-date data and analysis on the situation of children.

Latest publication

Statistics by Country
Current Status + Progress
Rapid acceleration of progress is needed to achieve universal primary education by 2015

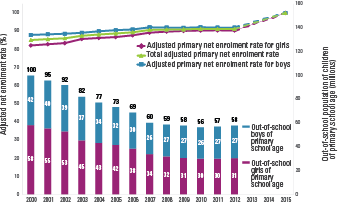
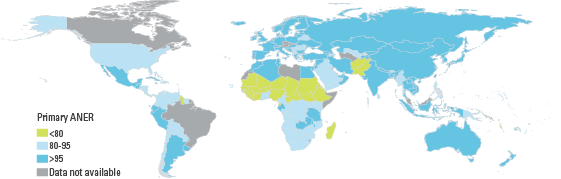
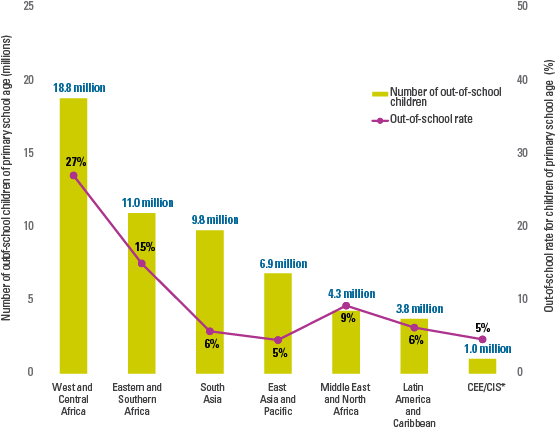
Worldwide, 91 per cent of primary-school-age children were enrolled in school in 2012. However, at the current rate of progress, the MDG target for universal primary education is unlikely to be met.  The challenge is most acute in West and Central Africa, where net enrolment is 73 per cent. Although the number of out-of-school children of primary school age declined globally from 100 million to 58 million between 2000 and 2012, progress has stalled since 2007.

More than half of countries and areas worldwide have achieved or nearly achieved universal primary education – that is, they have a net enrolment rate or net attendance rate of more than 95 per cent. In about 20 countries, however, net enrolment or attendance is less than 80 per cent. These countries are concentrated mainly in West and Central Africa and in South Asia, and many of them are affected by conflict. 

The lowest rates of school participation are found in Western and Central Africa and South Asia
Primary school net enrolment rate or net attendance rate (percentage)

Notes:  Net enrolment data are prioritized. Net attendance data from surveys were used when primary net enrolment data were not available.

Sources:UNESCO Institute for Statistics global databases, 2015, based on administrative data for the most recent year available during the period 2008─2013. UNICEF global databases, 2015, based on Multiple Indicator Cluster Surveys (MICS), Demographic and Heath Surveys (DHS) and other nationally representative surveys, 2008–2014. Data for China were provided by the Chinese Ministry of Education.

DISPARITIES IN PRIMARY EDUCATION

In many countries, children from the poorest 20 per cent of the population are less likely to attend school than those who are better off, with each successive quintile having a higher average attendance . The largest disparities of all are in West and Central Africa. In Burkina Faso, for example, 85 per cent of children from the wealthiest households attended primary school in 2010, compared with less than a third of children from the poorest quintile. Children in rural areas are in general more disadvantaged, being almost twice as likely to be out of primary school as their urban counterparts. In Niger, 83 per cent of children in urban areas attended primary school in 2012, whereas only 45 percent of rural children did so in 2012.

In many countries, poorer children are far less likely to go to school than their wealthier peers
Primary school net attendance rate (percentage), by household wealth quintile, sex, and residence, 2008–2014

Notes: Calculation is based on most recent household surveys conducted during the period 2008-2014 with the exceptions of 2006 data from Brazil and 2005-06 data from India. The average was calculated based on weighted net attendance rates. Primary and secondary school age populations were used as the weights.

Source: UNICEF global databases, 2015.

CHILDREN OUT OF SCHOOL

In 2012, an estimated 58 million children of primary school age were out of school; 53 per cent of them were girls. About one third of the world’s out-of-school children live in West and Central Africa; about one fifth are in Eastern and Southern Africa. In West and Central Africa, more than a quarter of all primary-school-age children are out of school. In Liberia, the out-of-school rate rises to 59 percent. In South Asia, Pakistan faces the largest challenge in terms of both the proportion (28 per cent) and number (5.4 million) of children out of school.

About 58 million children of primary school age are out of school; more than half of them are girls
Number and percentage of out-of-school children of primary school age, by region, 2012

* CEE/CIS: Central and Eastern Europe and the Commonwealth of Independent States.

Source: UNESCO Institute for Statistics global databases, 2014.

GENDER EQUALITY

More than two thirds of countries and areas have reached gender parity in primary education. However, girls remain at a disadvantage in many countries, particularly in Africa, the Middle East and South Asia. In South Sudan, for example, the gender parity index, or GPI, is 0.66, meaning that 66 girls are enrolled in primary school for every 100 boys. 

Gender disparities in primary education persist in Africa, the Middle East and South Asia
Gender parity index (ratio of the number of female students enrolled in primary school to the number of male students)

Source: UNESCO Institute for Statistics global databases, 2015, based on administrative data for the most recent year available during the period 2010–2014.

LEARNING

While more and more children are attending school worldwide, many of them drop out or fail to meet minimum standards of learning. Of the world’s 650 million children of primary school age, 120 million do not reach Grade 4; another 130 million reach Grade 4 but fail to achieve a minimum level of learning.

Globally, 4 in 10 children fail to meet minimum learning standards
Number of children of primary school age worldwide who reach Grade 4 and achieve a minimum level of learning, who reach Grade 4 but fail to achieve a minimum level of learning, and who do not reach Grade 4, 2012

Source: UNESCO, Education for All Global Monitoring Report 2012: Youth and skills – Putting education to work, UNESCO, Paris, 2012.

Many countries in sub-Saharan Africa face the double challenge of non-completion and low learning performance in primary education. In Cote d'Ivoire, for example, only half of children reach Grade 4, either because they never enrolled or dropped out. In Togo, more than 70 per cent of children reach Grade 4, but less than 30 per cent of them master basic reading skills.

Many sub-Saharan African countries face the double challenge of non-completion and low learning performance
Percentage of cohort who reached Grade 4 and achieved a minimum level of learning in reading

Source:  UNESCO, Education for All Global Monitoring Report 2013/14: Teaching and Learning - Achieving Quality for All, UNESCO, Paris, 2014.

Access The Data
Data on primary education
Administrative data on school participation, including net and gross enrolment ratios and survival ratios, by educational level Download Data
Survey data on primary net attendance rate Download Data
Survey data on primary survival rate Download Data
Notes on the Data

For a full picture of children’s school participation, UNICEF uses two sources of data: enrolment data, which are based on administrative records, and attendance data from household surveys. In half of all countries, data on primary and secondary education come from more than one source.  All data on primary and secondary education used by UNICEF are based on official International Standard Classifications of Education (ISCED) and may deviate somewhat from those used by country-specific school systems. 

DEFINITION OF INDICATORS 

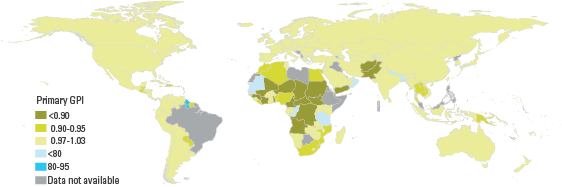
Gender parity index – The ratio of female-to-male values of a given indicator. A GPI of 1 indicates parity between the sexes.

Literacy rate – Total number of literate persons in a given age group, expressed as a percentage of the total population in that age group. The adult literacy rate measures literacy among persons aged 15 years and older, and the youth literacy rate measures literacy among persons aged 15 to 24 years.

Out-of-school population – Total number of primary or lower secondary-school-age children who are not enrolled in primary (ISCED 1) or secondary (ISCED 2 and 3) education.

Pre-primary school gross enrolment ratio – Number of children enrolled in pre-primary school, regardless of age, expressed as a percentage of the total number of children of official pre-primary school age.

Primary school gross enrolment ratio – Number of children enrolled in primary school, regardless of age, expressed as a percentage of the total number of children of official primary school age.

Primary school net attendance ratio – Number of children attending primary or secondary school who are of official primary school age, expressed as a percentage of the total number of children of official primary school age. Because of the inclusion of primary-school-age children attending secondary school, this indicator can also be referred to as a primary adjusted net attendance ratio.

Primary school net enrolment ratio – Number of children enrolled in primary or secondary school who are of official primary school age, expressed as a percentage of the total number of children of official primary school age. Because of the inclusion of primary-school-age children enrolled in secondary school, this indicator can also be referred to as a primary adjusted net enrolment ratio.

Secondary school net attendance ratio – Number of children attending secondary or tertiary school who are of official secondary school age, expressed as a percentage of the total number of children of official secondary school age. Because of the inclusion of secondary-school-age children attending tertiary school, this indicator can also be referred to as a secondary adjusted net attendance ratio.

Secondary school net enrolment ratio – Number of children enrolled in secondary school who are of official secondary school age, expressed as a percentage of the total number of children of official secondary school age. Secondary net enrolment ratio does not include secondary-school-age children enrolled in tertiary education, owing to challenges in age reporting and recording at that level.

Survival rate to last primary grade – Percentage of children entering the first grade of primary school who eventually reach the last grade of primary school.

REFERENCES

  1. UNESCO, Education for All Global Monitoring Report 2013/14: Teaching and Learning - Achieving Quality for All, UNESCO, Paris, 2014.
  2. UNESCO Institute for Statistics, global databases, 2014.
  3. UNESCO Institute for Statistics, Global Education Digest 2012, Opportunities Lost: The impact of grade repetition and early school leaving, UIS, Montreal, 2012.
  4. UNICEF, The State of the World’s Children 2015: Reimagine the Future - Innovation for Every Child, UNICEF, New York, 2014.